Monitoring WatchTower In Grafana
WatchTower
 A process for automating Docker container base image updates.\
Prerequisite
- Docker
- Prometheus
My Prometheus is host in my k3s cluster. Also it is a same way to configure with prometheus config.
- Grafana
- Discord(for notification)
Installation
- Create
docker-compose.ymlfor deploy WatchTower.\
1
2
3
4
5
6
7
8
9
10
11
12
13
14
15
16
17
18
19
20
21
22
23
24
25
26
27
28
29
30
31
32
33
34
35
36
37
38
39
40
41

version: '3.8'
services:
  watchtower:
    image: containrrr/watchtower
    container_name: watchtower
    ports:
      - 8080:8080
    restart: always
    volumes:
      - /var/run/docker.sock:/var/run/docker.sock
    environment:
      WATCHTOWER_SCHEDULE: "0 0 1 * * *" # In everyday 01:00
      TZ: Asia/Hong_Kong
      WATCHTOWER_HTTP_API_TOKEN: "your-token"
      WATCHTOWER_HTTP_API_METRICS: "true"
      WATCHTOWER_CLEANUP: "true"
      WATCHTOWER_DEBUG: "true"
      WATCHTOWER_NOTIFICATION_REPORT: "true"
      WATCHTOWER_NOTIFICATION_URL: "discord://${TOKEN}@${CHANNEL_ID}"
      WATCHTOWER_NOTIFICATION_TEMPLATE: |
        {{- if .Report -}}
          {{- with .Report -}}
        {{len .Scanned}} Scanned, {{len .Updated}} Updated, {{len .Failed}} Failed
              {{- range .Updated}}
        - {{.Name}} ({{.ImageName}}): {{.CurrentImageID.ShortID}} updated to {{.LatestImageID.ShortID}}
              {{- end -}}
              {{- range .Fresh}}
        - {{.Name}} ({{.ImageName}}): {{.State}}
            {{- end -}}
            {{- range .Skipped}}
        - {{.Name}} ({{.ImageName}}): {{.State}}: {{.Error}}
            {{- end -}}
            {{- range .Failed}}
        - {{.Name}} ({{.ImageName}}): {{.State}}: {{.Error}}
            {{- end -}}
          {{- end -}}
        {{- else -}}
          {{range .Entries -}}{{.Message}}{{"\n"}}{{- end -}}
        {{- end -}}
if you want to monitor remote server, add below line into environment.
DOCKER_HOST: "tcp://remote-docker-server:2375"
Up the container
docker-compose up -dCheck the process, it will show like this below
1
94345236d0d4   containrrr/watchtower           "/watchtower"            1 days ago      Up 1 days     0.0.0.0:8080->8080/tcp                                     watchtower
Configure Prometheus
- Edit your prometheus.yml
1
2
3
4
5
6
7
8
scrape_configs:
 - job_name: watchtower
   scrape_interval: 5s
   metrics_path: /v1/metrics
   bearer_token: your-token
   static_configs:
     - targets:
       - 'dockersrv:8080'
Go to prometheus webui to check the target status.
http://prometheus:9090/targets?search=
something like below,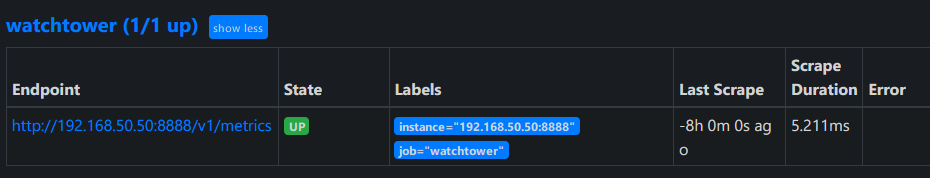
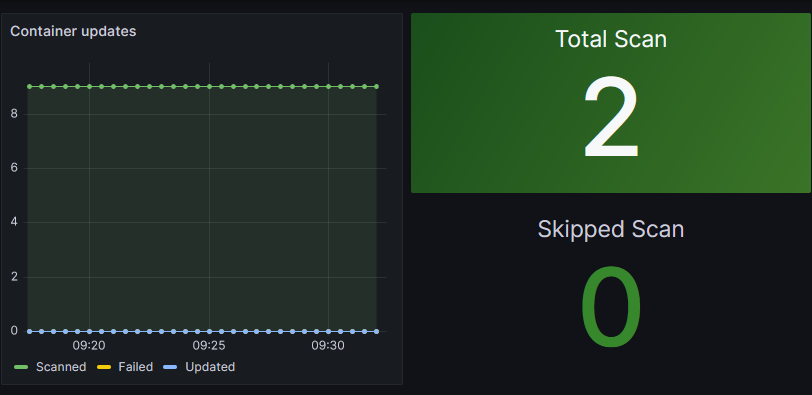
Then logon Grafana and import watchtower dashboard.
Kubernetes prometheus config update soon…
In Addition
Enable TCP port 2375 for external connection: —
- Create
daemon.jsonfile in/etc/docker:
1
{"hosts": ["tcp://0.0.0.0:2375", "unix:///var/run/docker.sock"]}
- Add
/etc/systemd/system/docker.service.d/override.conf
1
2
3
[Service]
ExecStart=
ExecStart=/usr/bin/dockerd
- Reload the systemd daemon:
1
systemctl daemon-reload
- Restart docker:
1
systemctl restart docker.service
- Test your port is open with another device, I use netcat for scan. you can use telnet also
1
nc -zv dockersrv 2375
1
Connection to dockersrv (10.0.50.11) 2375 port [tcp/*] succeeded!
This post is licensed under CC BY 4.0 by the author.