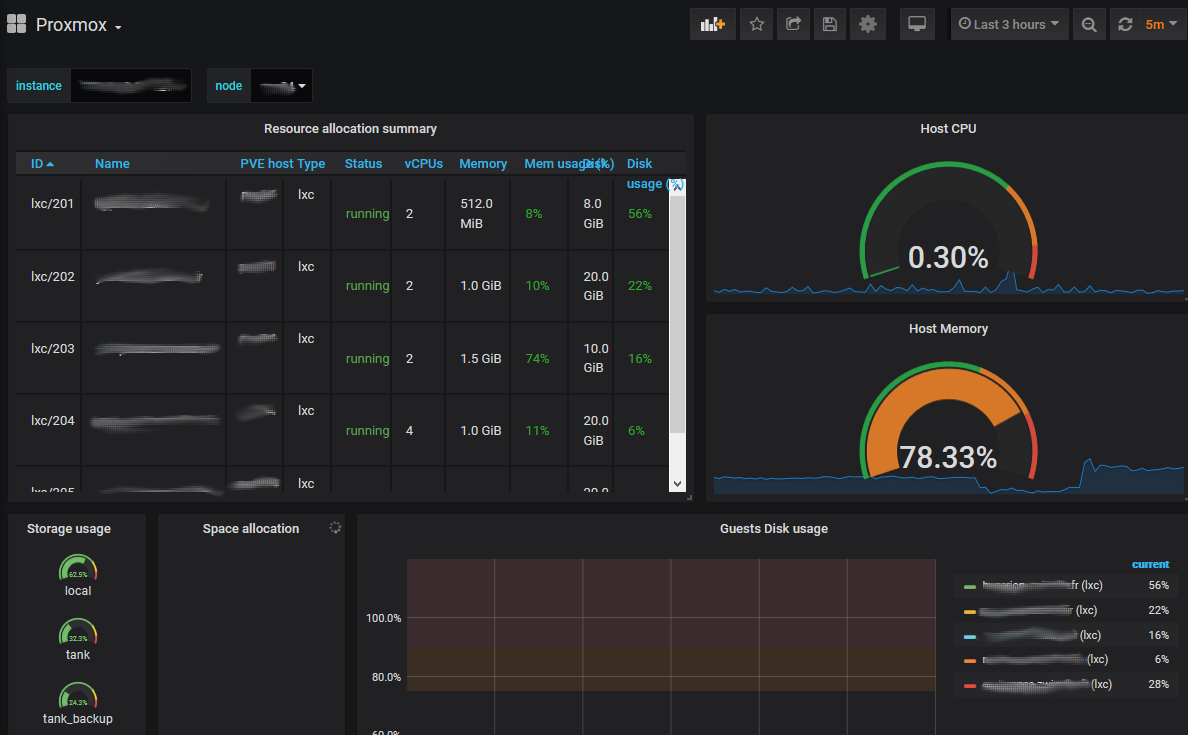
Monitor Your Proxmox with Grafana & Prometheus
Prerequisites
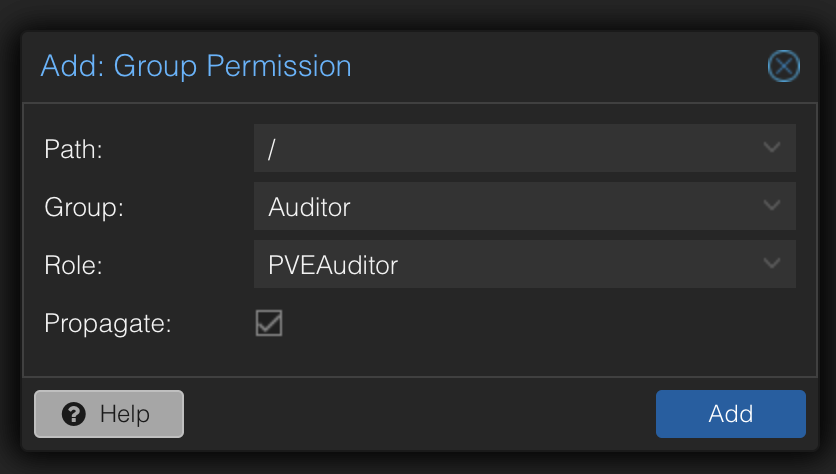
- Create a User on Proxmox and assign PVEAuditor role
- Log into your pve, go to
DataCenter > Permissions > Groups,Create A group name as auditor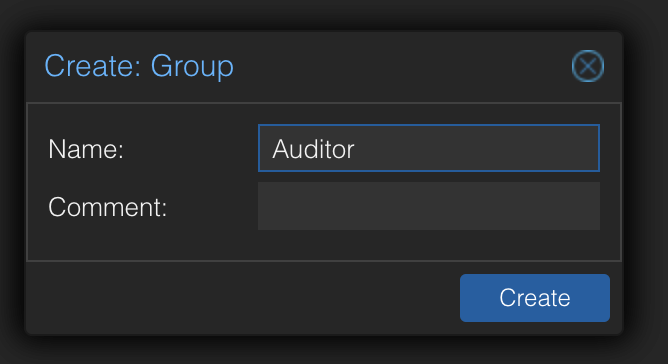
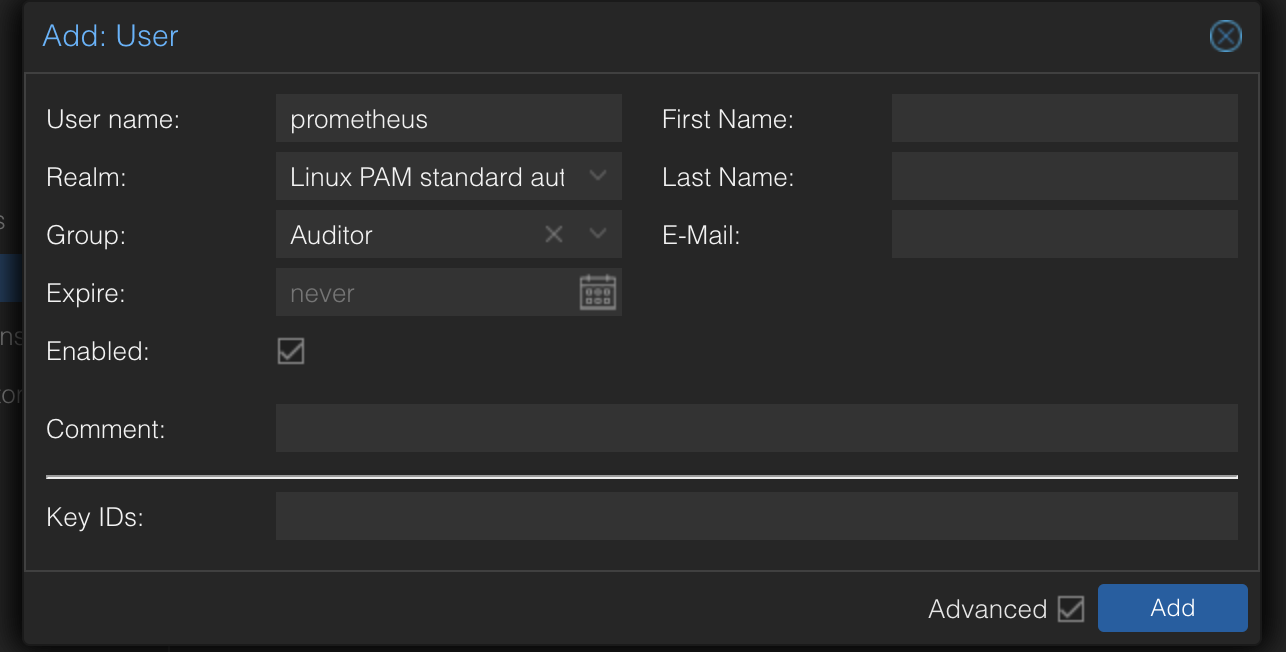
- Create a user name as prometheus@pve
- Add group permissions
- Docker
- Prepare 1 node for deploy prompve/prometheus-pve-exporter
Installation
Project Structure
1
2
3
4
5
6
7
8
9
10
11
.
├── docker-compose.yml
├── grafana
│   └── provisioning
│       ├──── dashboards
│       │     ├─── dashboard.yml
│       │     └─── pve_with_prom.json
│       └──── datasources
│             └── datasource.yml
└── prometheus
    └── prometheus.yml
Docker node
prometheus-pve-exporter is for scraping metrics from pve. Create a config file pve.yml
1
2
3
4
5
default:
    user: prometheus@pve
    password: password
    # Optional: set to false to skip SSL/TLS verification
    verify_ssl: true
or for token authenication
1
2
3
4
default:
    user: prometheus@pve
    token_name: "your-token-id"
    token_value: "..."
create a docker-run.sh
1
docker run --init --name prometheus-pve-exporter -d -p 127.0.0.1:9221:9221 -v ./pve.yml:/etc/pve.yml prompve/prometheus-pve-exporter
Prepare Prometheus config
prometheus.yml
1
2
3
4
5
6
7
8
9
10
11
12
13
14
15
16
17
18
19
20
scrape_configs:
  - job_name: 'pve'
    static_configs:
      - targets:
        - 192.168.1.2  # Proxmox VE node.
        - 192.168.1.3  # Proxmox VE node.
    metrics_path: /pve
    params:
      module: [default]
      cluster:
        - 1
      node:
        - 1
    relabel_configs:
      - source_labels: [__address__]
        target_label: __param_target
      - source_labels: [__param_target]
        target_label: instance
      - target_label: __address__
        replacement: 127.0.0.1:9221  # PVE exporter.
Prepare Grafana config.env & provisioning
config.env
1
2
GF_SECURITY_ADMIN_PASSWORD=password
GF_USERS_ALLOW_SIGN_UP=false
./grafana/provisioning/datasources/datasource.yml
1
2
3
4
5
6
7
8
9
10
11
12
13
14
15
16
17
18
19
20
21
22
23
24
25
26
27
28
29
30
31
32
33
34
35
36
37
38
39
40
41
42
43
44
45
46
47
48
49
50
# config file version
apiVersion: 1

# list of datasources that should be deleted from the database
deleteDatasources:
  - name: Prometheus
    orgId: 1

# list of datasources to insert/update depending
# whats available in the database
datasources:
  # <string, required> name of the datasource. Required
- name: Prometheus
  # <string, required> datasource type. Required
  type: prometheus
  # <string, required> access mode. direct or proxy. Required
  access: proxy
  # <int> org id. will default to orgId 1 if not specified
  orgId: 1
  # <string> url
  url: http://prometheus:9090
  # <string> database password, if used
  password:
  # <string> database user, if used
  user:
  # <string> database name, if used
  database:
  # <bool> enable/disable basic auth
  basicAuth: false
  # <string> basic auth username, if used
  basicAuthUser:
  # <string> basic auth password, if used
  basicAuthPassword:
  # <bool> enable/disable with credentials headers
  withCredentials:
  # <bool> mark as default datasource. Max one per org
  isDefault: true
  # <map> fields that will be converted to json and stored in json_data
  jsonData:
     graphiteVersion: "1.1"
     tlsAuth: false
     tlsAuthWithCACert: false
  # <string> json object of data that will be encrypted.
  secureJsonData:
    tlsCACert: "..."
    tlsClientCert: "..."
    tlsClientKey: "..."
  version: 1
  # <bool> allow users to edit datasources from the UI.
  editable: true
grafana/provisioning/dashboards/dashboard.yml
1
2
3
4
5
6
7
8
9
10
11
apiVersion: 1

providers:
- name: 'Prometheus'
  orgId: 1
  folder: ''
  type: file
  disableDeletion: false
  editable: true
  options:
    path: /etc/grafana/provisioning/dashboards
- provisioning your dashboard, your can import a json for your pve monitoring.
pve_with_prom.json
Deploy Prometheus & Grafana with using Docker
docker-compose.yml
1
2
3
4
5
6
7
8
9
10
11
12
13
14
15
16
17
18
19
20
21
22
23
24
25
26
27
28
29
30
31
32
33
34
35
36
37
38
39
40
41
42
43
44
45
46
47
48
49
version: '3.7'
services:

  prometheus:
    image: prom/prometheus:v2.40.0
    volumes:
      - ./prometheus/:/etc/prometheus/
      - prometheus_data:/prometheus
    command:
      - '--config.file=/etc/prometheus/prometheus.yml'
      - '--storage.tsdb.path=/prometheus'
      - '--web.console.libraries=/usr/share/prometheus/console_libraries'
      - '--web.console.templates=/usr/share/prometheus/consoles'
    ports:
      - 9090:9090
    networks:
      - monitor
    restart: always


  grafana:
    image: grafana/grafana
    depends_on:
      - prometheus
    ports:
      - 3000:3000
    volumes:
      - grafana_data:/var/lib/grafana
      - ./grafana/provisioning/:/etc/grafana/provisioning/

    env_file:
      - ./grafana/config.env
    networks:
      - monitor
    restart: always

volumes:
  prometheus_data:
    driver_opts:
      type: nfs
      o: addr=192.168.1.250,nfsvers=4 #your nas ip
      device: :/volume1/docker/prometheus-grafana/prometheus
  grafana_data:
    driver_opts:
      type: nfs
      o: addr=192.168.1.250,nfsvers=4 #your nas ip
      device: :/volume1/docker/prometheus-grafana/grafana
networks:
  monitor:
Run docker-compose up -d
Dashboard
Import dashboard ID - 10347
Additional
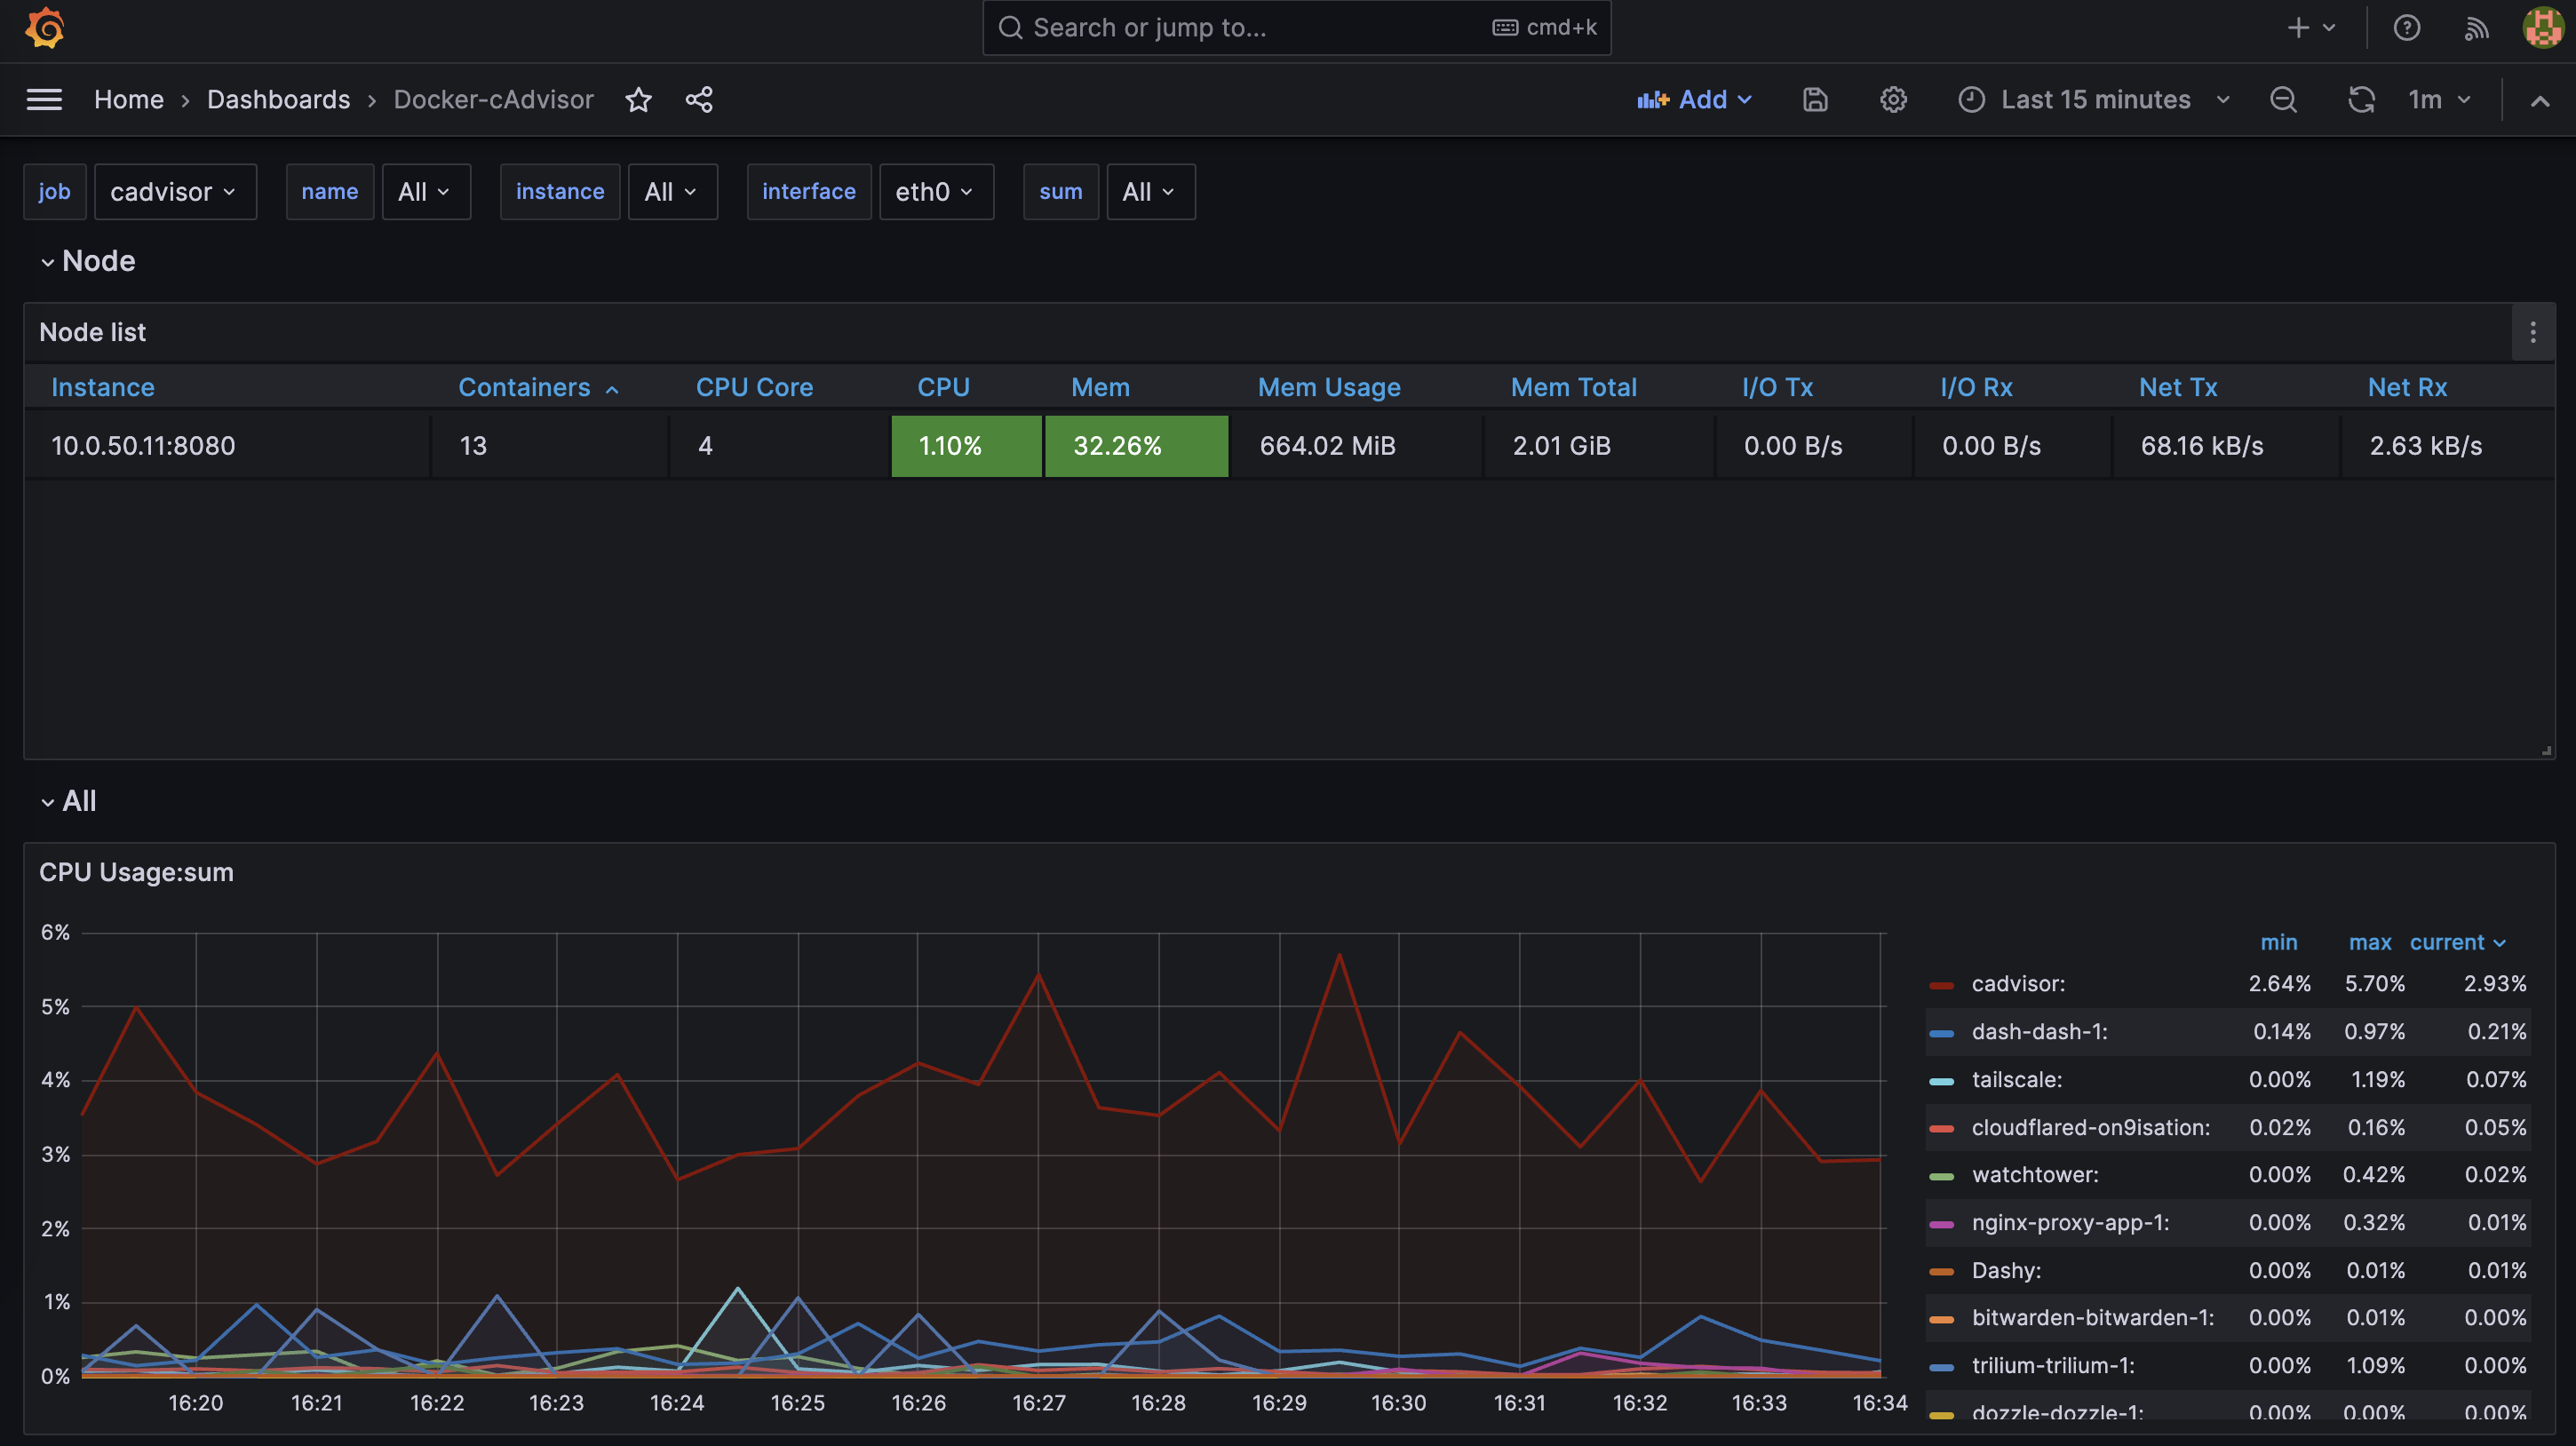
Cadvisor - Monitor containers metrics
Install cadvisor in docker-server docker-compose.yml
1
2
3
4
5
6
7
8
9
10
11
12
13
14
version: '3.9'
services:
  cadvisor:
    image: gcr.io/cadvisor/cadvisor:latest
    container_name: cadvisor
    privileged: true
    ports:
    - 8080:8080
    volumes:
    - /:/rootfs:ro
    - /var/run:/var/run:rw
    - /sys:/sys:ro
    - /var/lib/docker/:/var/lib/docker:ro
    - /dev/disk/:/dev/disk:ro
cadvisor dashboard here - cadvisor
prometheus.yml
1
2
3
4
5
  - job_name: cadvisor
    scrape_interval: 5s
    static_configs:
    - targets:
      - cadvisor:8080
This post is licensed under CC BY 4.0 by the author.